Transportation Data Portal
The Transportation Data Portal provides curated datasets, maps, and summaries to support local planning efforts. While other pages like Crash Data offer interactive tools that can be tailored to individual jurisdictions, this portal presents a regional overview with high-level trends, cleaned data, and CAPCOG’s analysis to inform decision-making.
Crash Data Report: CAPCOG Region, 2015–2024
This report analyzes motor vehicle crashes in the 10-county CAPCOG region—Bastrop, Blanco, Burnet, Caldwell, Fayette, Hays, Lee, Llano, Travis, and Williamson—from 2015 to 2024. Data is sourced from the Texas Department of Transportation (TxDOT) via formal request; see TxDOT Crash Records Request.
The Stakes
From 2015 to 2024, the region recorded:
- 3,013 fatalities
- 14,042 serious injuries
- 877,870 total crashes
These preventable losses underscore the need for targeted safety improvements in road design and speed management.
Crash Hotspots: Urban Centers Dominate
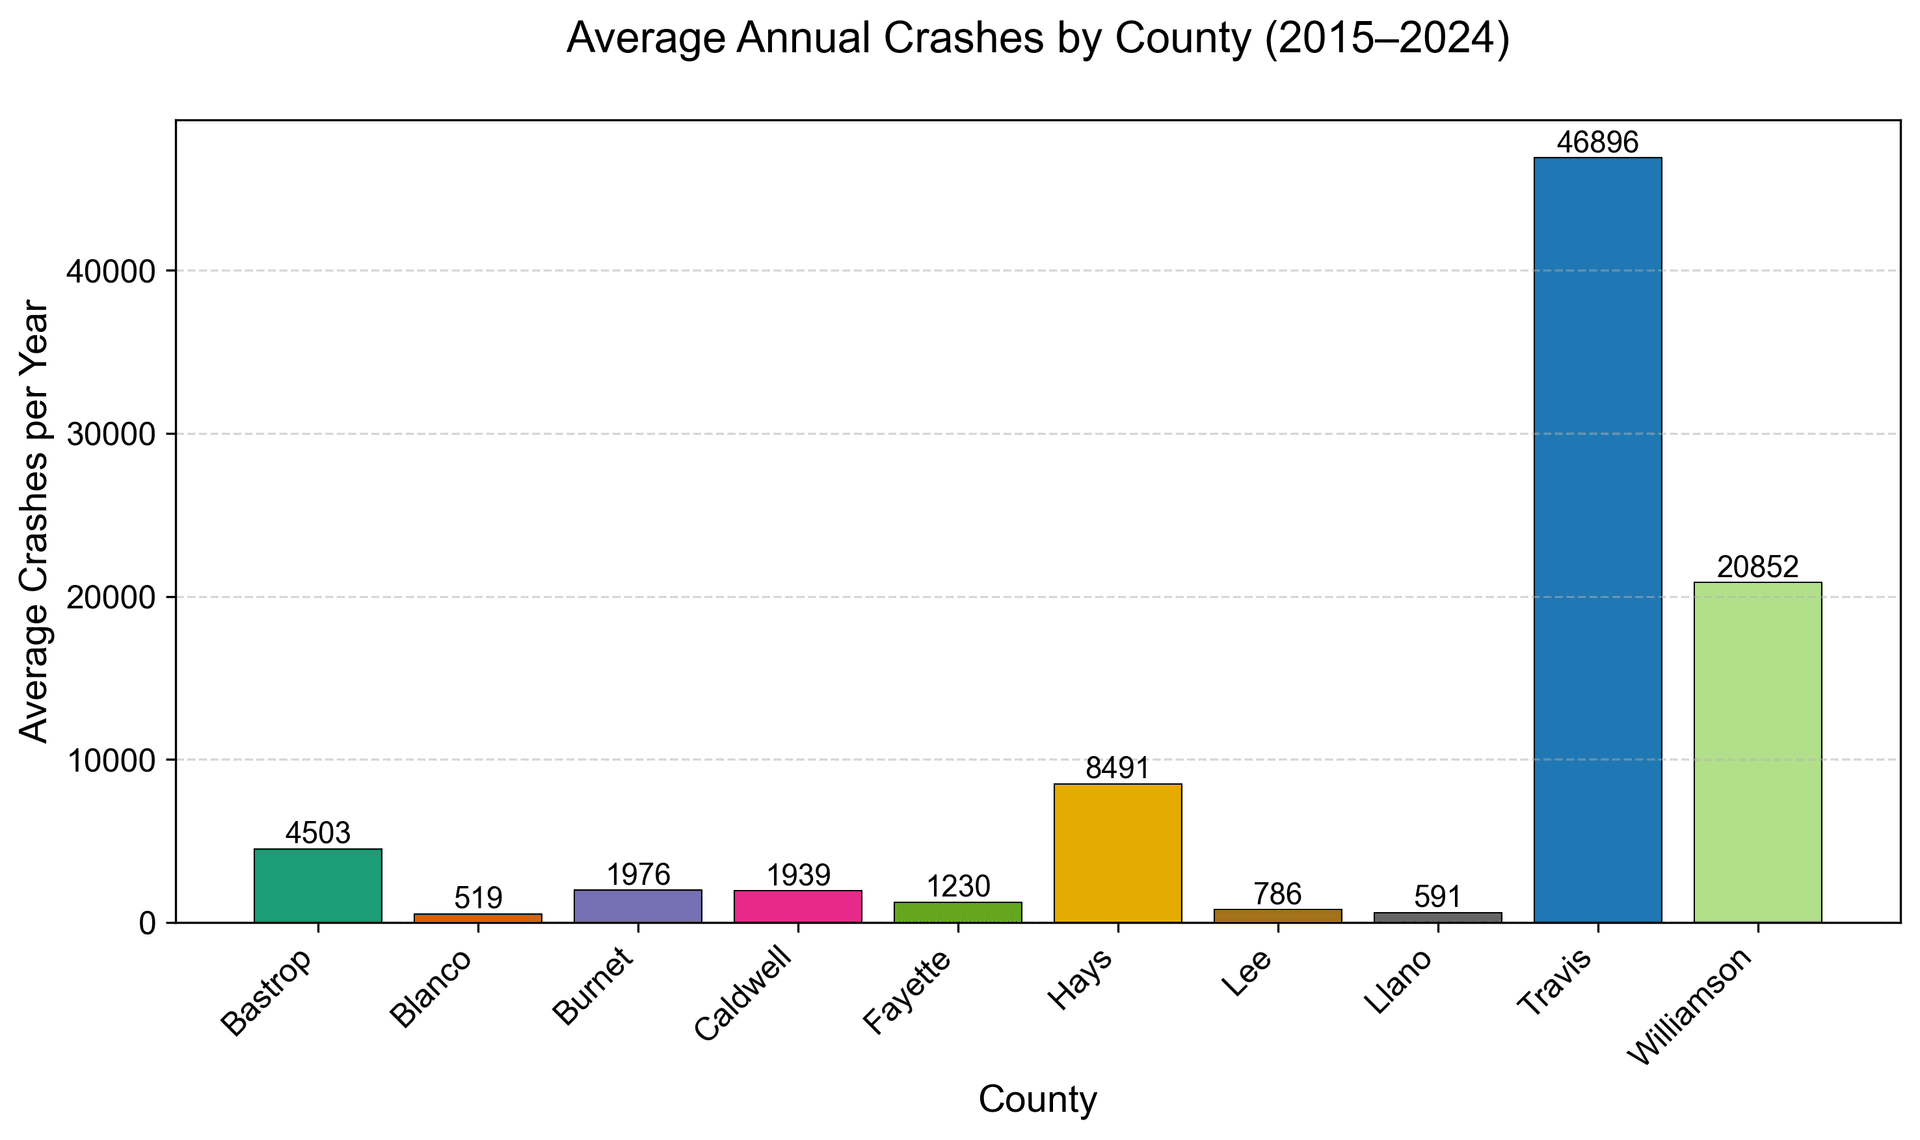
Urban counties bear the brunt of crash volume: Travis averages 46,896 crashes annually, Williamson 20,852. Rural Bastrop, at 4,503, shows a notable burden for its size. Region-wide, crashes dropped to 7,141.0 per county in 2020 from a pre-2020 average of 9,199.7, rebounding to 8,890.6 post-2020, reflecting pandemic-driven shifts in mobility.
Crash Severity: Rising Fatal Outcomes
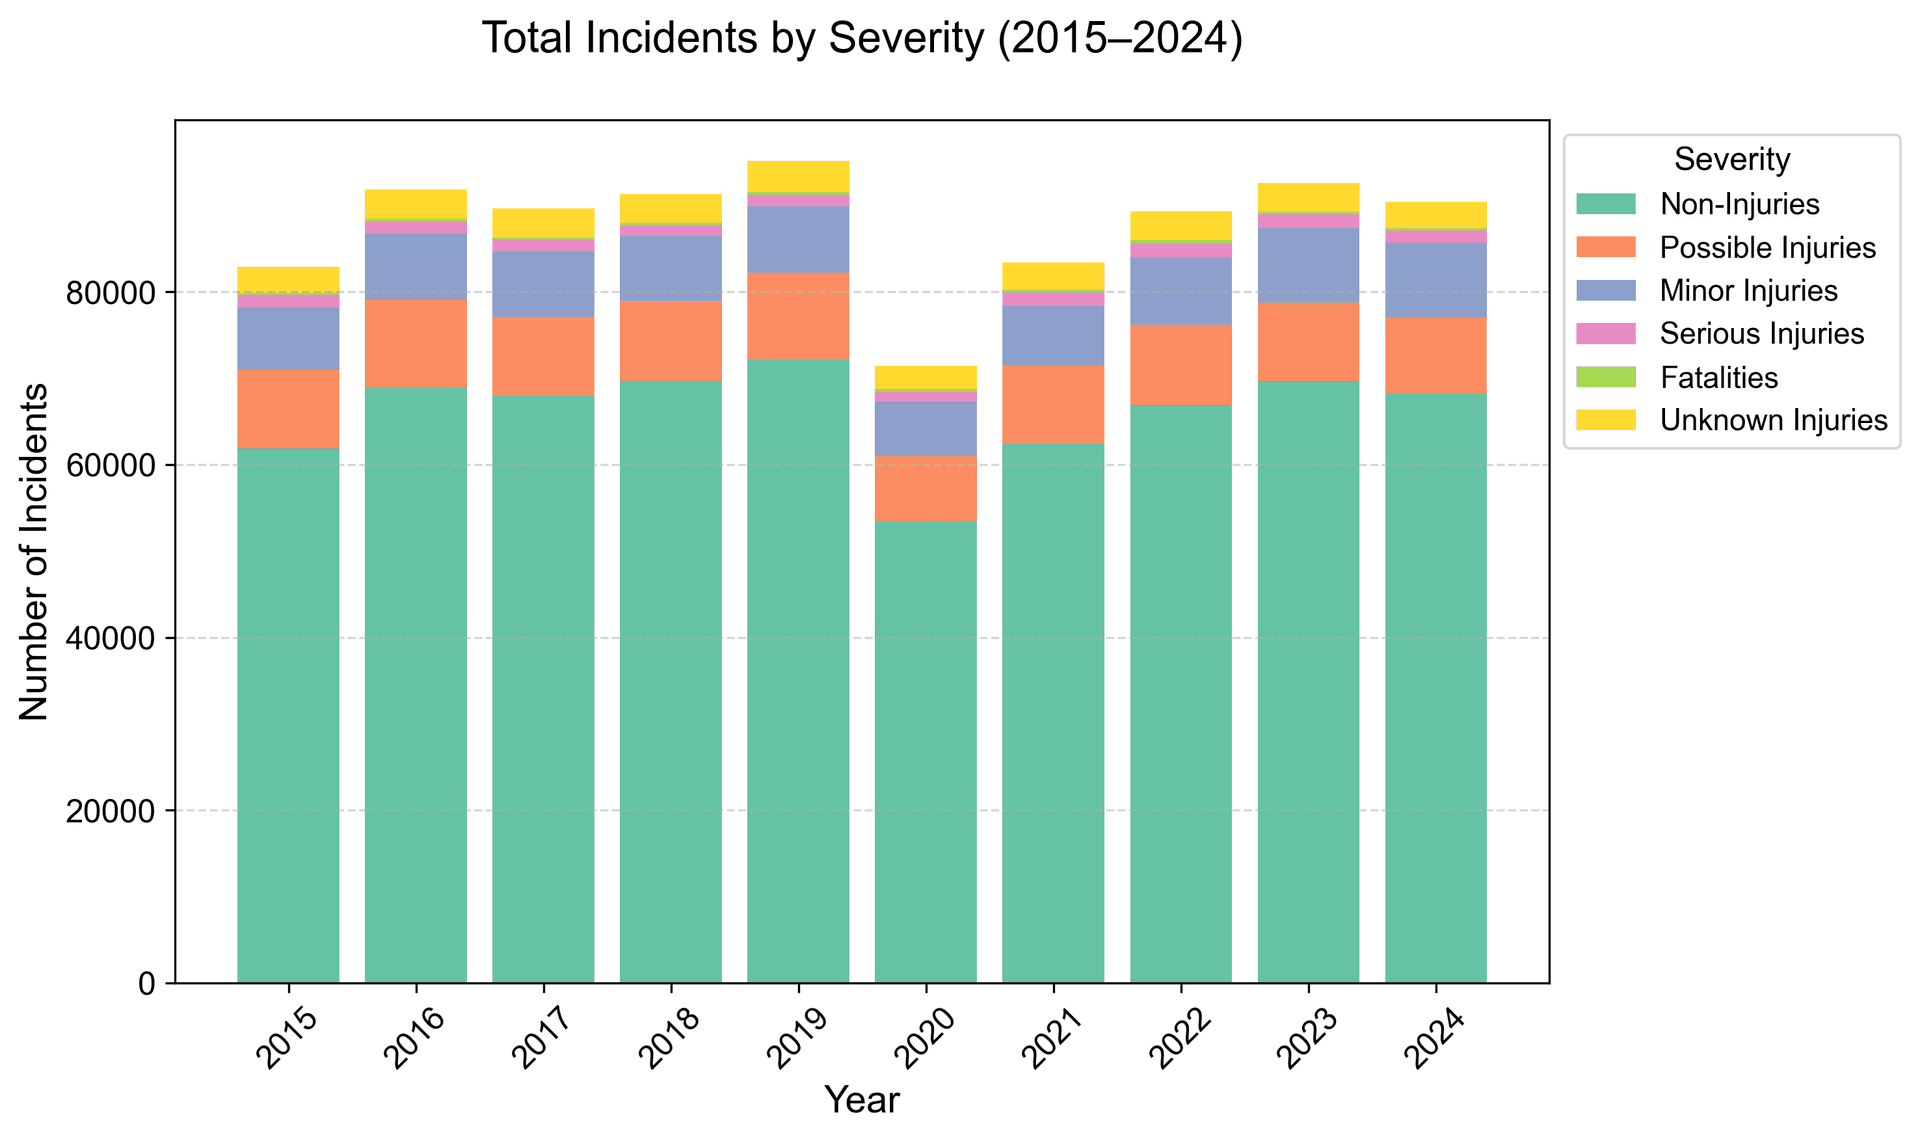
Most crashes (661,087) are non-injurious, but severe outcomes are increasing. Fatalities rose from 27.6 per county pre-2020 to 33.2 post-2020, and serious injuries climbed from 136.0 to 153.4. Despite fewer crashes in 2020 (7,141.0), higher speeds on emptier roads likely drove deadlier outcomes, a trend that persists post-pandemic.
Fatalities Over Time: Rural Spikes Emerge
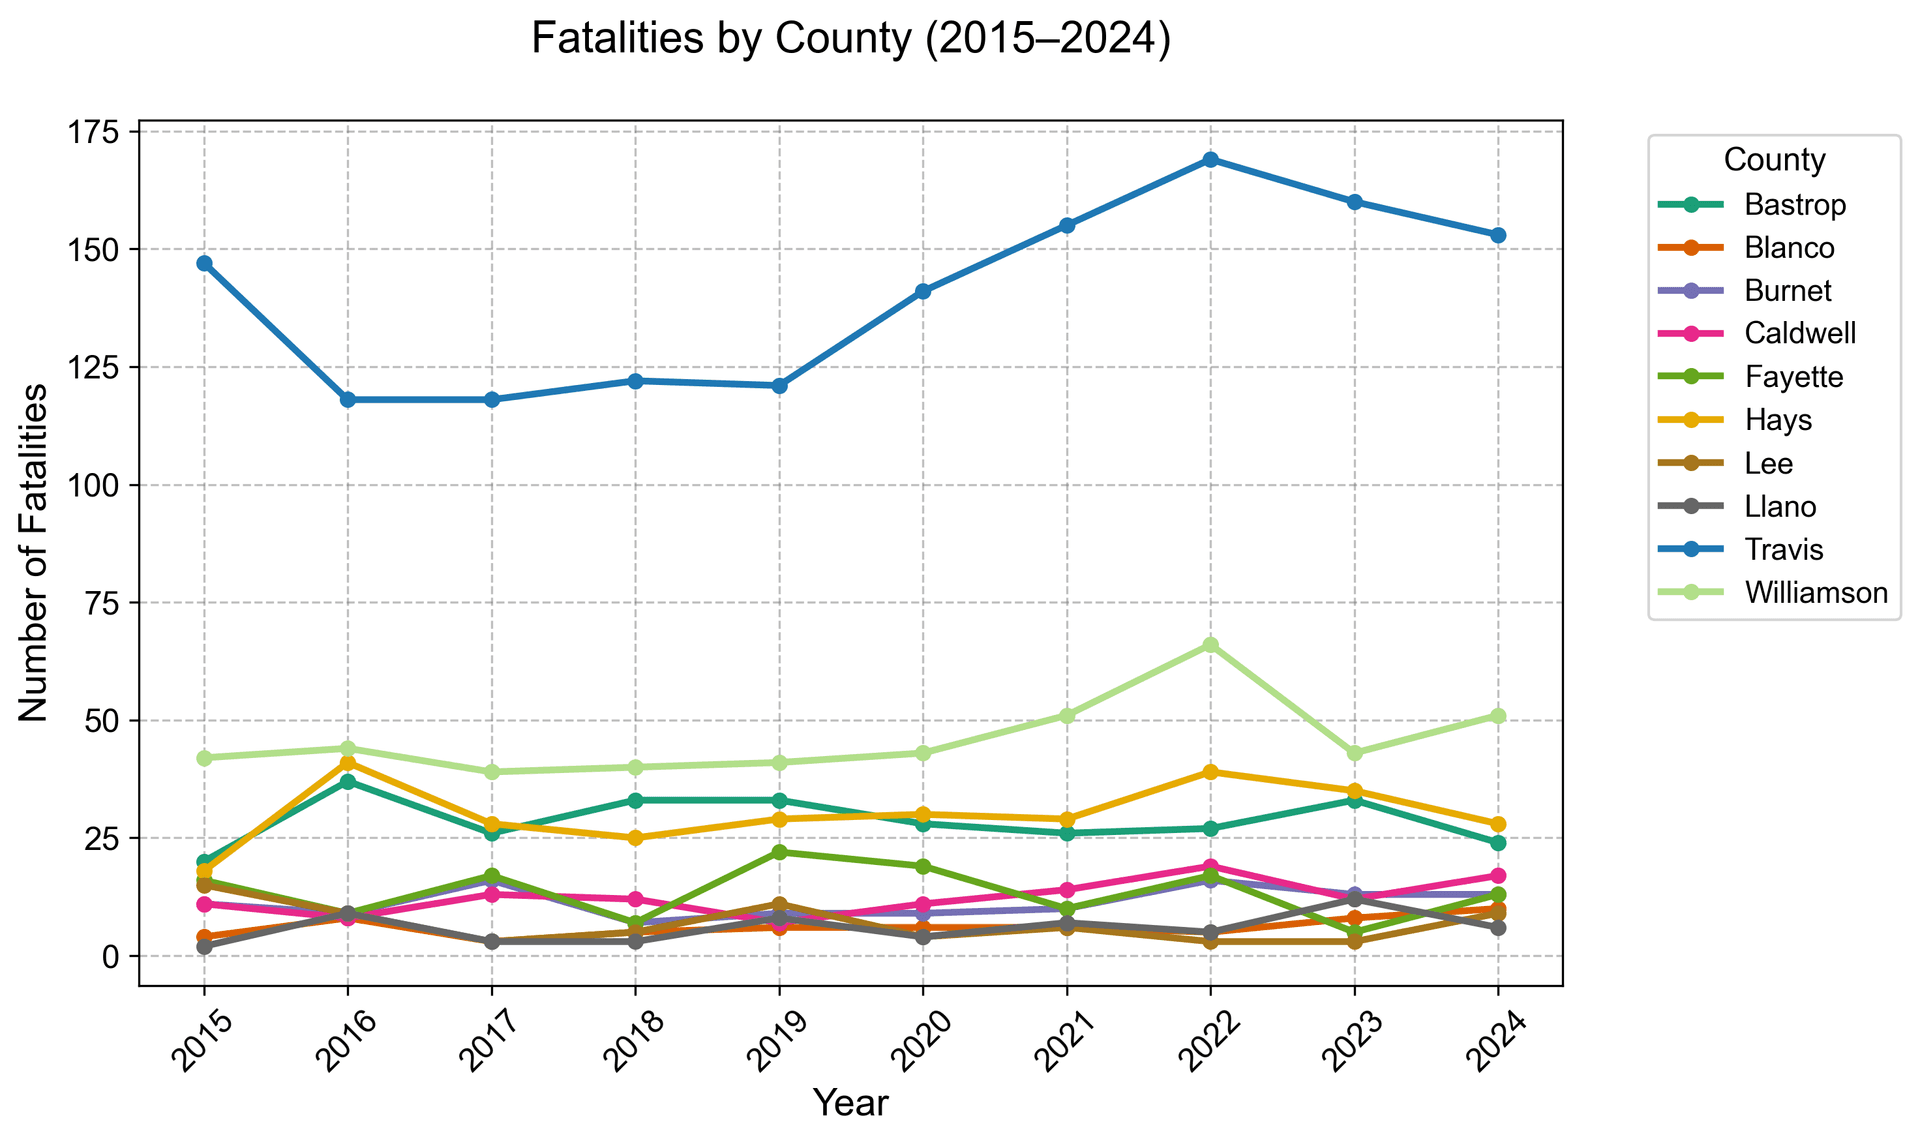
Fatalities dipped to 295 in 2020, then surged to 366 in 2022, stabilizing at 324 in 2024. Travis and Williamson show consistent high counts, but rural Bastrop spiked to 33 deaths in 2023 and 24 in 2024, signaling emerging risks possibly tied to rural road conditions or driver behavior.
Severity by County: Rural Roads Deadlier
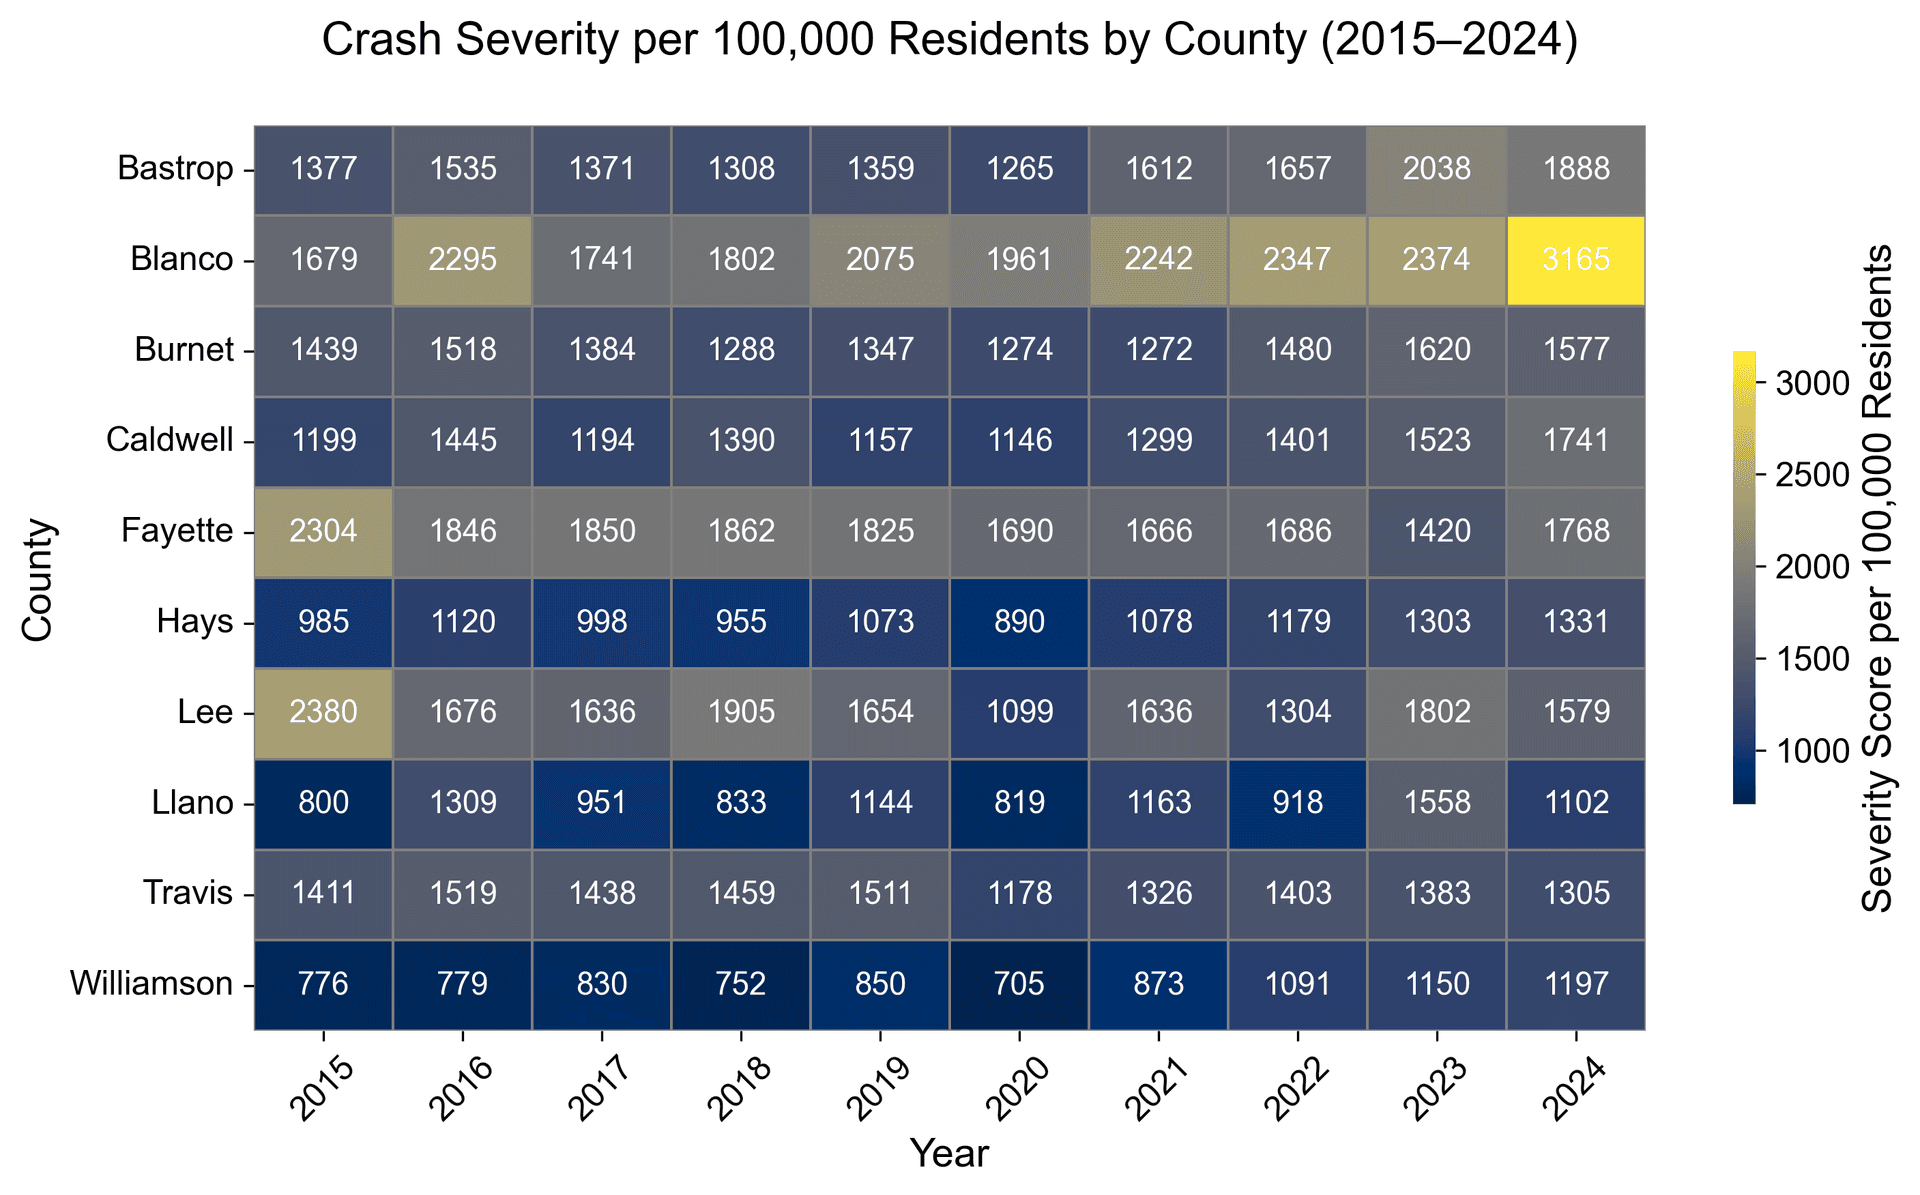
Rural counties face higher per-capita severity: Blanco hit 3,165 per 100K in 2024, Bastrop 2,037.7 in 2023, and Fayette 1,768.0 in 2024, compared to Travis’s 1,305.1. Higher speeds, limited infrastructure, and slower EMS response in rural areas amplify crash severity.
Injurious Crashes per Capita: Rural Risk Grows
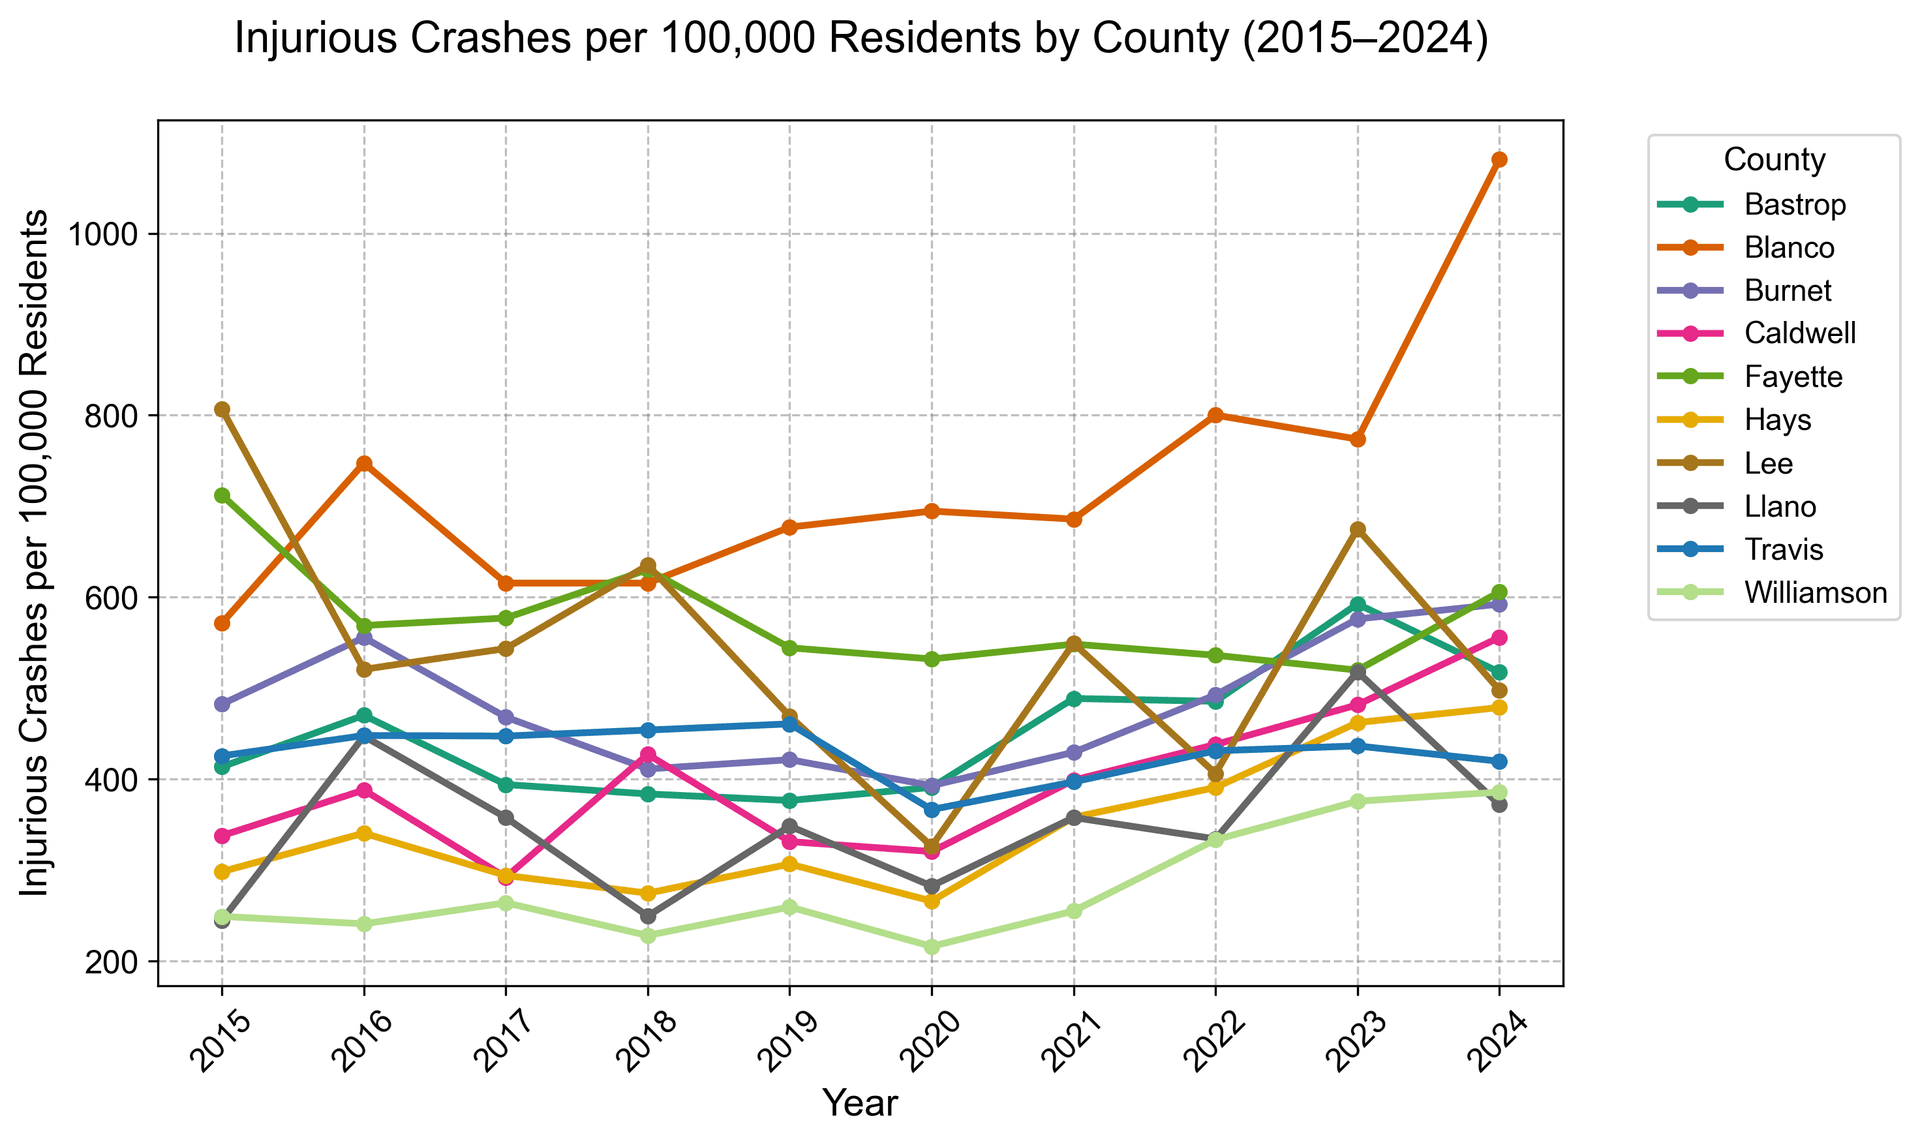
Rural injurious crash rates are climbing: Blanco reached 1,081 per 100K in 2024, Fayette 605.7, and Bastrop 517.4, far exceeding Travis’s 419.6. Urban areas have lower rates but higher raw totals due to volume, while rural trends suggest worsening conditions over the decade.
Fatalities vs. Serious Injuries: Linked Risks
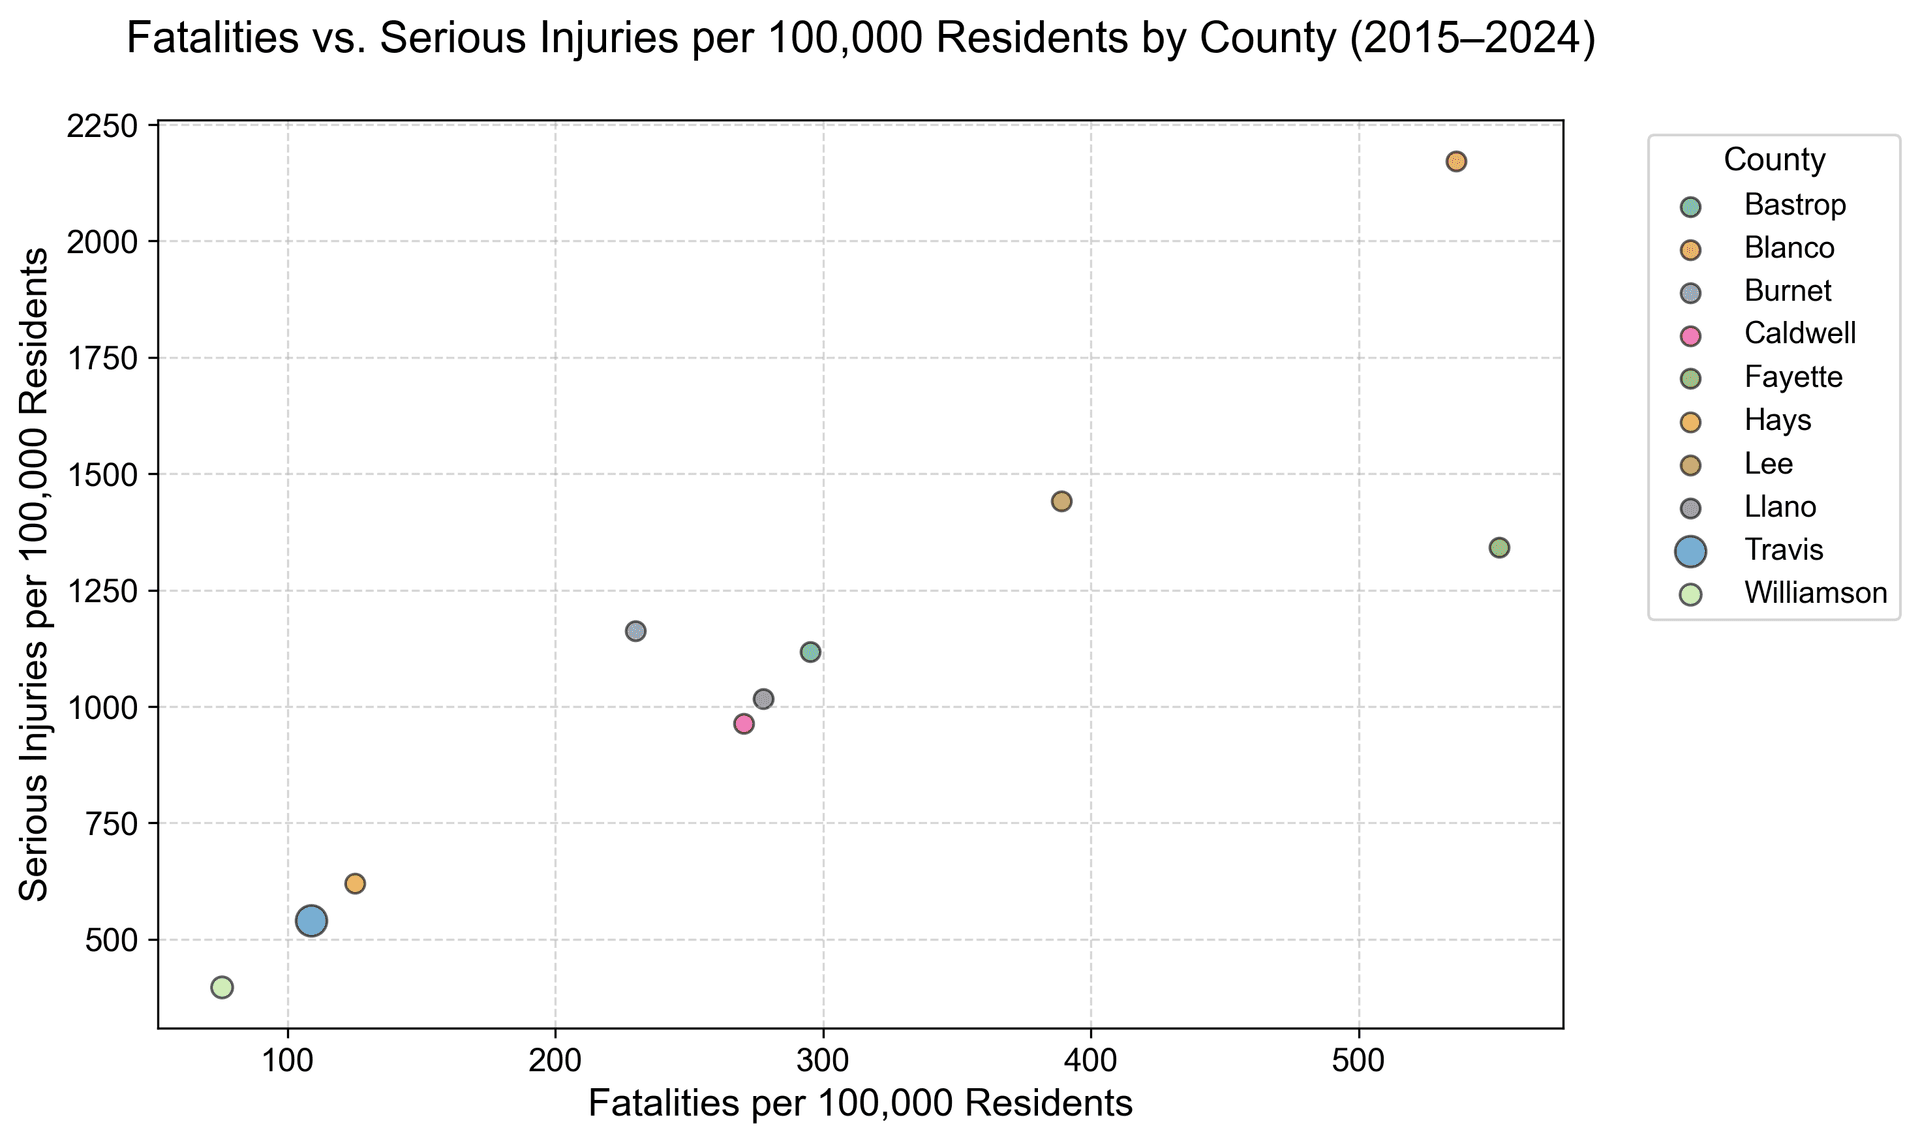
Fatalities and serious injuries correlate strongly: Fayette leads with 552.5 fatalities and 1,342.3 serious injuries per 100K, followed by Blanco at 536.3 and 2,171.6, while Travis logs 108.8 and 541.1. Rural areas face higher per-capita risks, straining limited emergency resources.
Fatalities per Capita: Rural Crisis
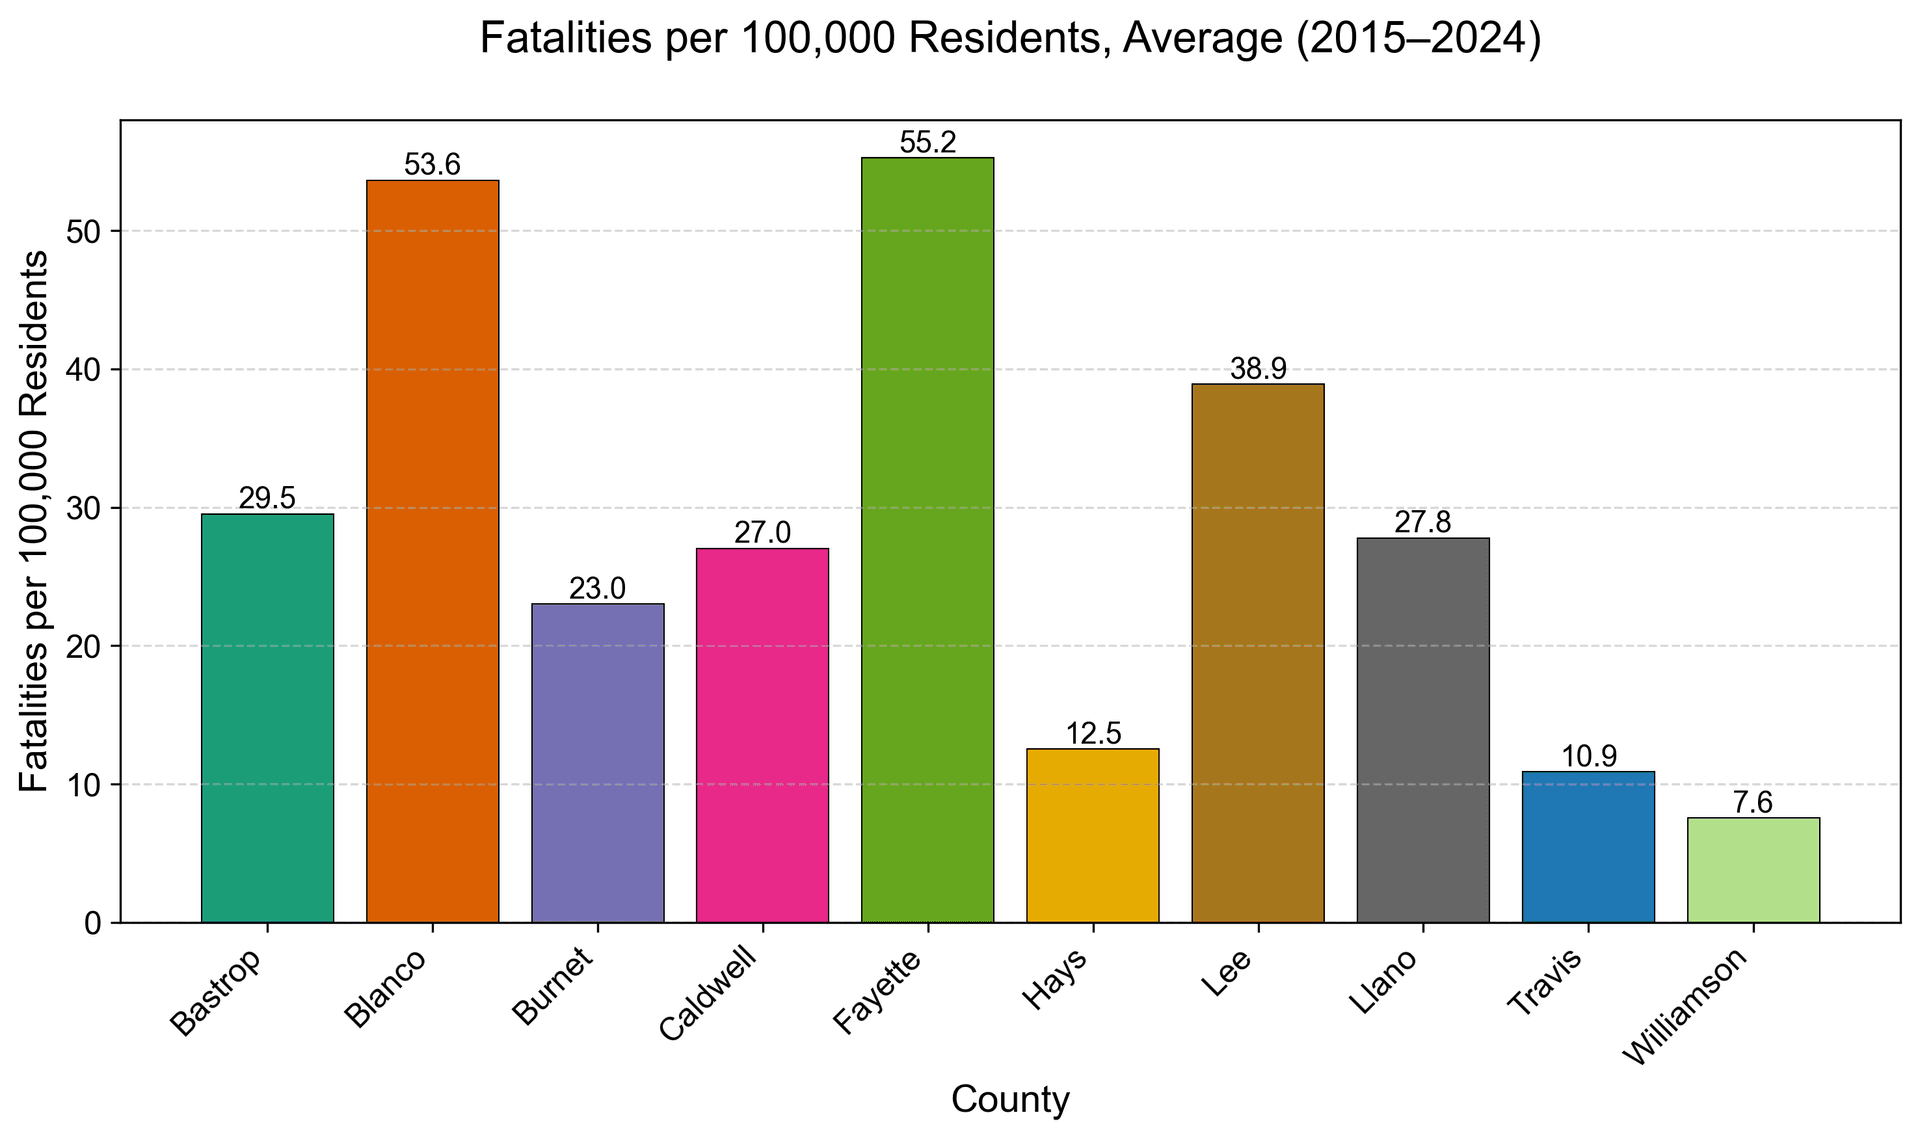
Rural fatality rates dwarf urban ones: Fayette averages 55.2 per 100K, Blanco 53.6, and Lee 38.9, compared to Travis’s 10.9 and Williamson’s 7.6. Rural residents face a far higher risk per person, highlighting the need for targeted safety measures.
Urban vs. Rural Risk: A Clear Divide
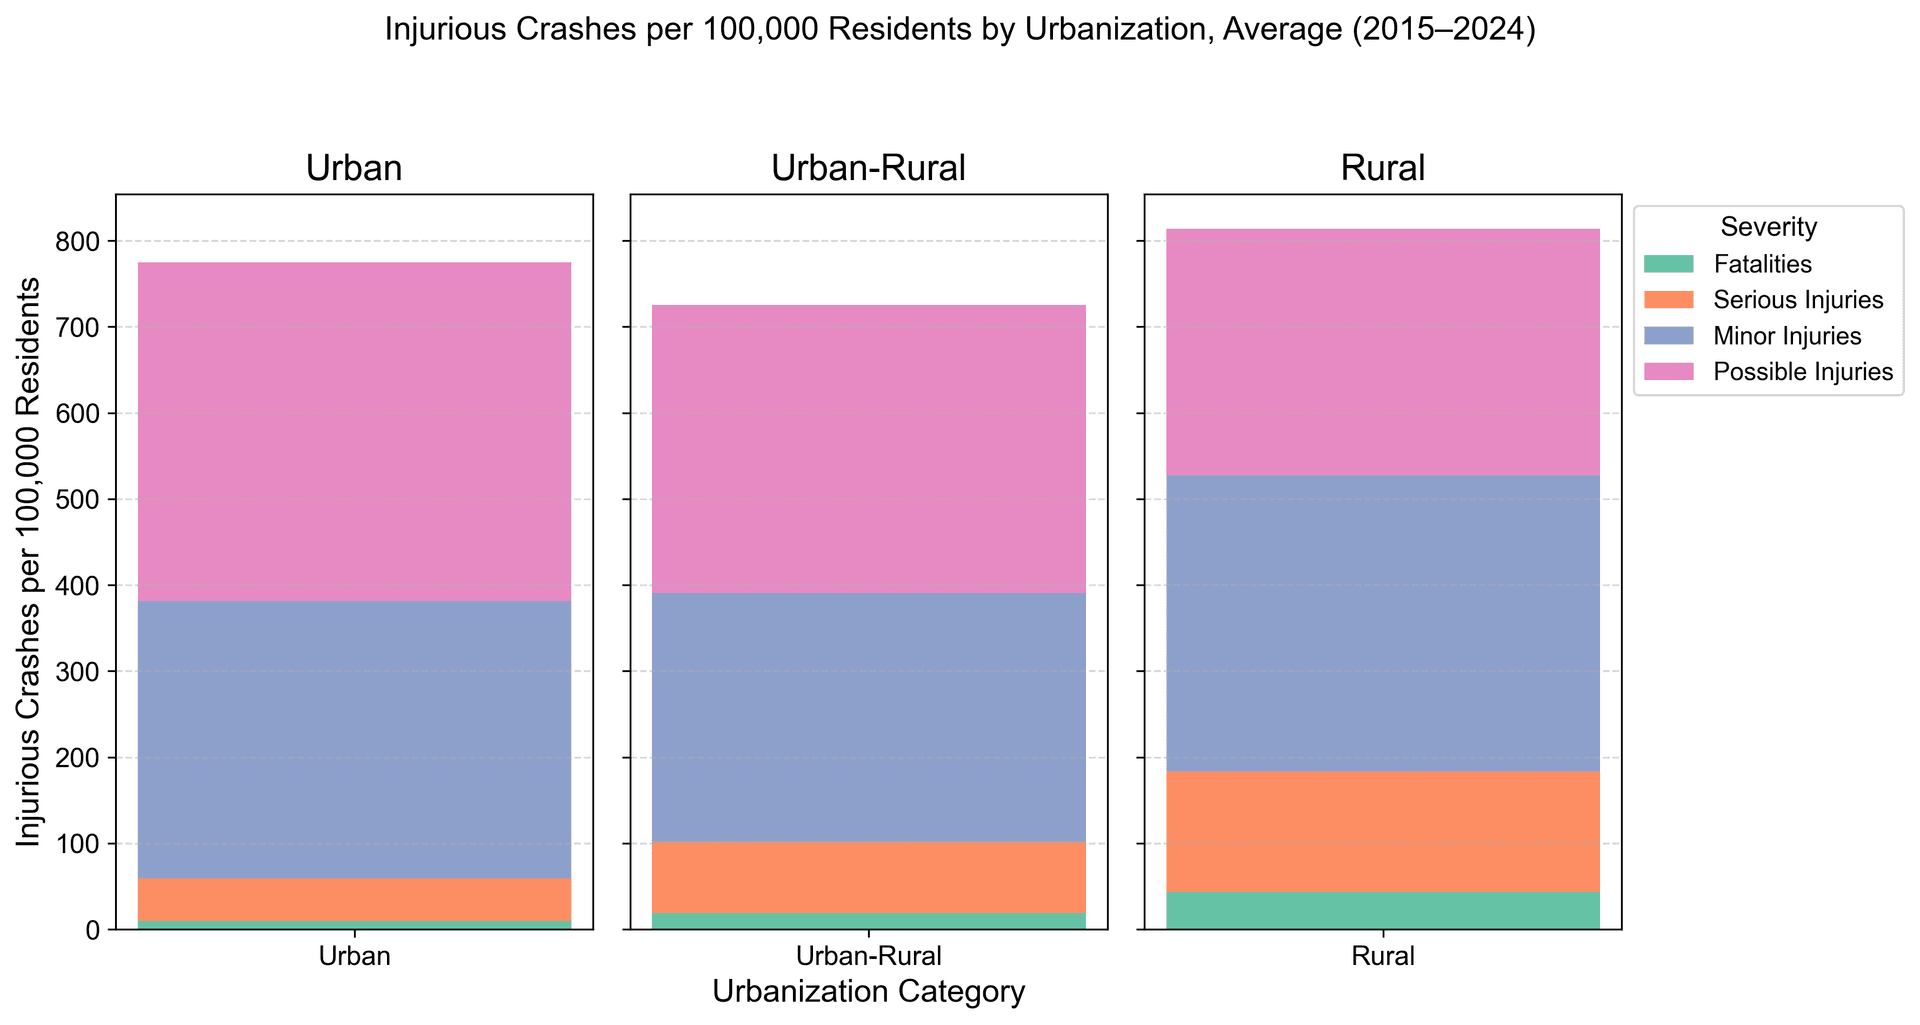
Rural areas (<25,000) average 43.3 fatalities and 139.9 serious injuries per 100K, compared to urban (>500,000) at 9.8 and 49.5. Urban-rural (25,000–500,000) counties fall in between at 19.1 and 83.0. Rural serious injuries rose from 122.1 pre-2020 to 159.3 post-2020, underscoring the need for rural-focused interventions.
Crash Rate Volatility: Uneven Trends

Crash rates fluctuated widely: Travis dropped 28.2% in 2020, while Lee surged 43.8% in 2021. Recent trends show rural declines (Lee -13.3% in 2024) and urban-rural increases (Bastrop 12.8% in 2024), reflecting uneven recovery and varying local conditions.
Population vs. Crash Risk: Size Matters Less
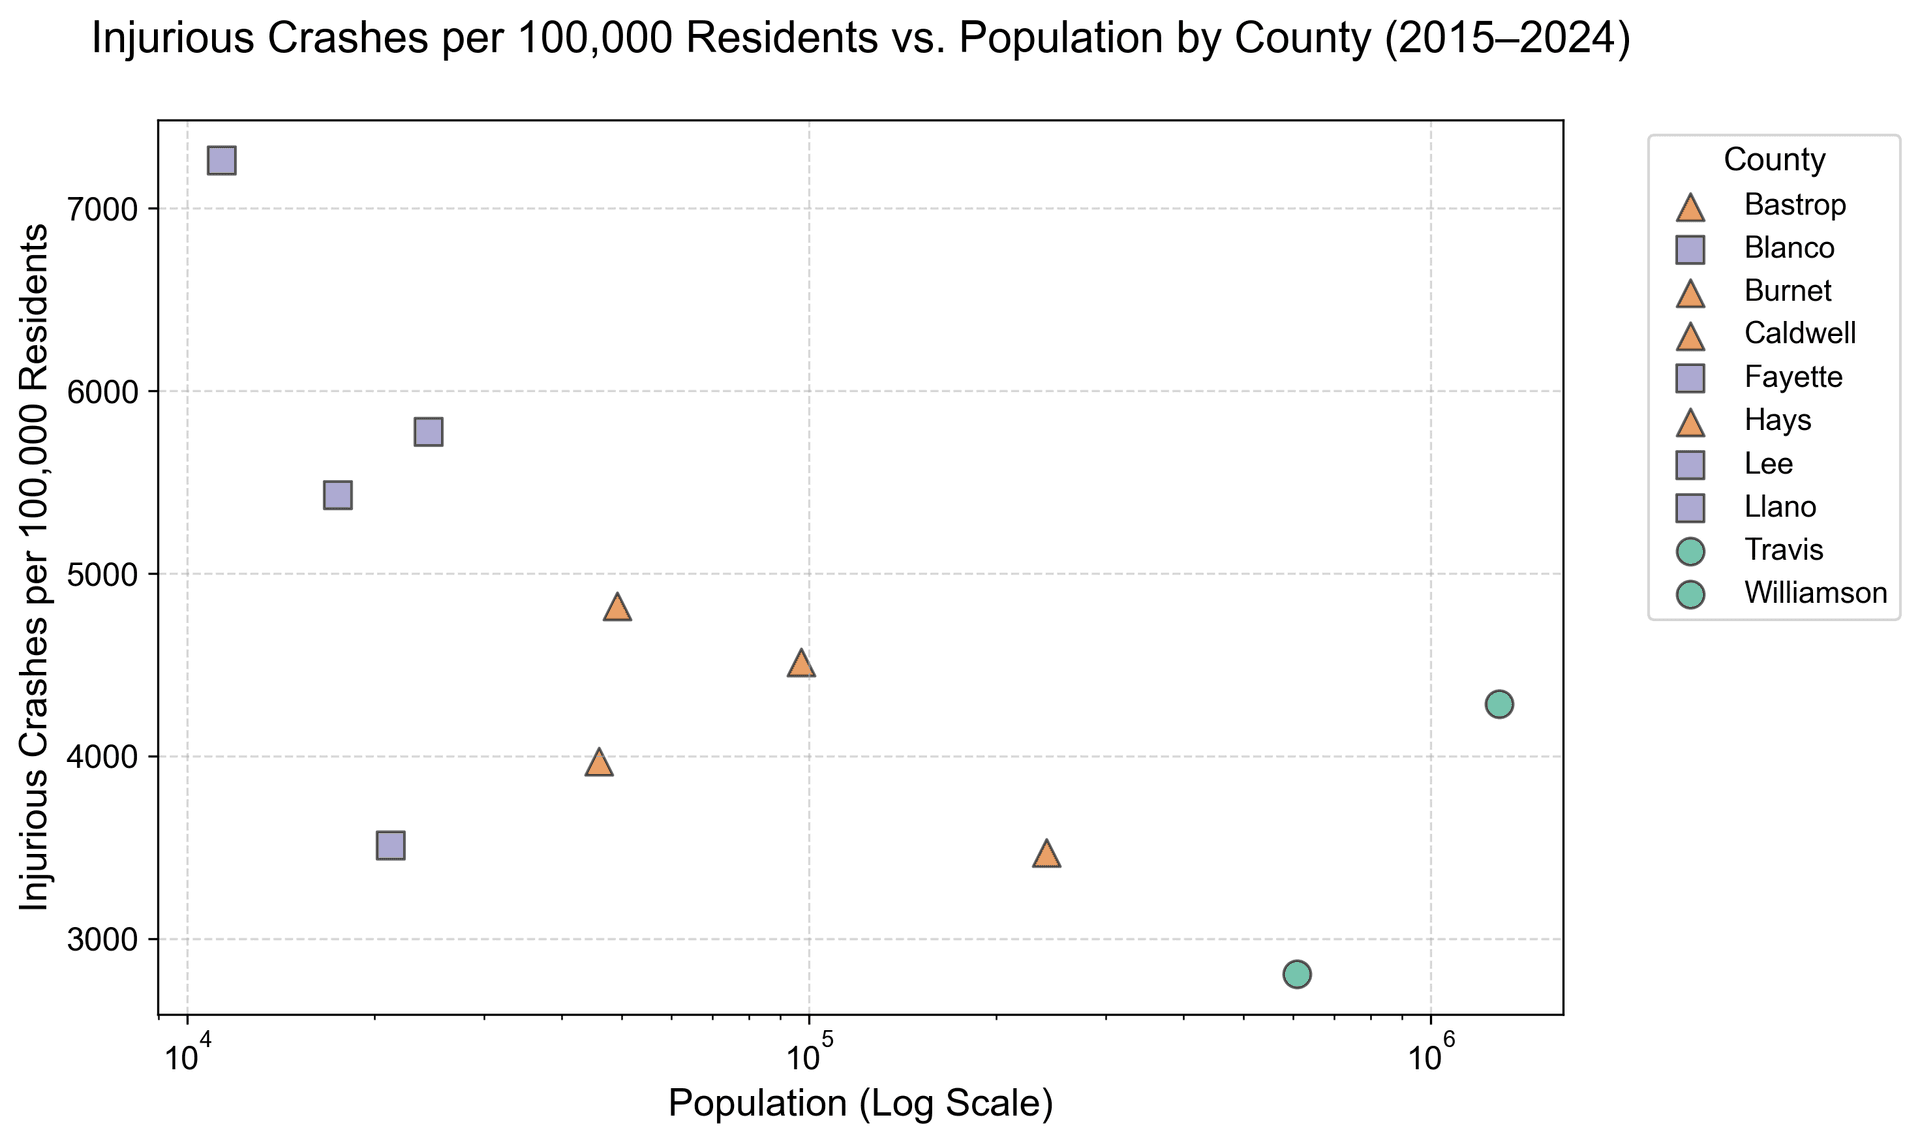
Population and injurious crashes per 100K show a negative correlation (-0.35). Blanco (11,374 residents) faces 7,262.2 per 100K, while Travis (1,290,188) logs 4,285.9. Smaller counties bear higher per-capita risks, likely due to rural road hazards.
The Bottom Line
Urban counties like Travis (46,896 crashes/year) face high crash volumes, while rural areas like Blanco (7,262.2 injurious crashes per 100K) and Fayette (55.2 fatalities per 100K) bear a heavier per-capita burden. Fatalities (33.2 post-2020) and serious injuries (153.4 post-2020) are rising, with volatility—Lee’s 43.8% spike in 2021, Travis’s -28.2% drop in 2020—highlighting uneven risks. Central Texas must address urban scale, rural severity, and volatility to achieve zero deaths.